Empowering
Precise Financial Decisions
Track, analyze, and optimize your investment portfolio with advanced analytics, multi-currency support, and real-time performance metrics.

Track, analyze, and optimize your investment portfolio with advanced analytics, multi-currency support, and real-time performance metrics.
Everything you need to track and optimize your investment portfolio
Visualize your portfolio's growth over time with interactive charts. Compare your performance against market benchmarks with time-period filters (3M, 6M, YTD, 1Y, 5Y, ALL).

Monitor portfolio volatility with rolling 30-day risk analysis. Understand your risk exposure compared to market benchmarks with annualized volatility metrics.

Track professional-grade metrics: Sharpe Ratio (risk-adjusted returns), Beta (market correlation), Treynor Ratio (systematic risk returns), and Sortino Ratio (downside risk).
Quickly log buy and sell transactions with an intuitive form. Enter date, symbol, quantity (positive for buys, negative for sells), price, and additional costs. Supports multi-currency transactions.
Import your transaction history in bulk via CSV upload. Perfect for migrating from other platforms or uploading broker statements. Supports standard format: Date, Symbol, Quantity, Price, Other Cost, Currency.
View, filter, and manage all your transactions in one place. Filter by symbol, date range, or transaction type. Bulk delete unwanted entries. Your complete transaction history at your fingertips.
Trade in multiple currencies with automatic conversion to your base currency. Supports USD, EUR, JPY, GBP, AUD, CAD, CHF, CNY, HKD, NZD, SGD, IDR. Real-time exchange rates ensure accurate portfolio valuation.
Track stocks, cryptocurrencies, currencies, and commodities in one unified dashboard. Gold support in beta with more asset classes coming soon. Diversify your portfolio across multiple asset types.
Market data with 20-minute delay provides accurate portfolio valuation without the premium cost of real-time feeds. Perfect for long-term investors and swing traders who don't need tick-by-tick updates.
Explore the interface and features

Track all your holdings with detailed metrics including cost basis, current value, and gains/losses.

Visualize returns with interactive charts comparing your portfolio to market benchmarks.

Monitor volatility and risk-adjusted returns with professional-grade gauges and charts.

Complete transaction history with powerful filtering and bulk editing capabilities.
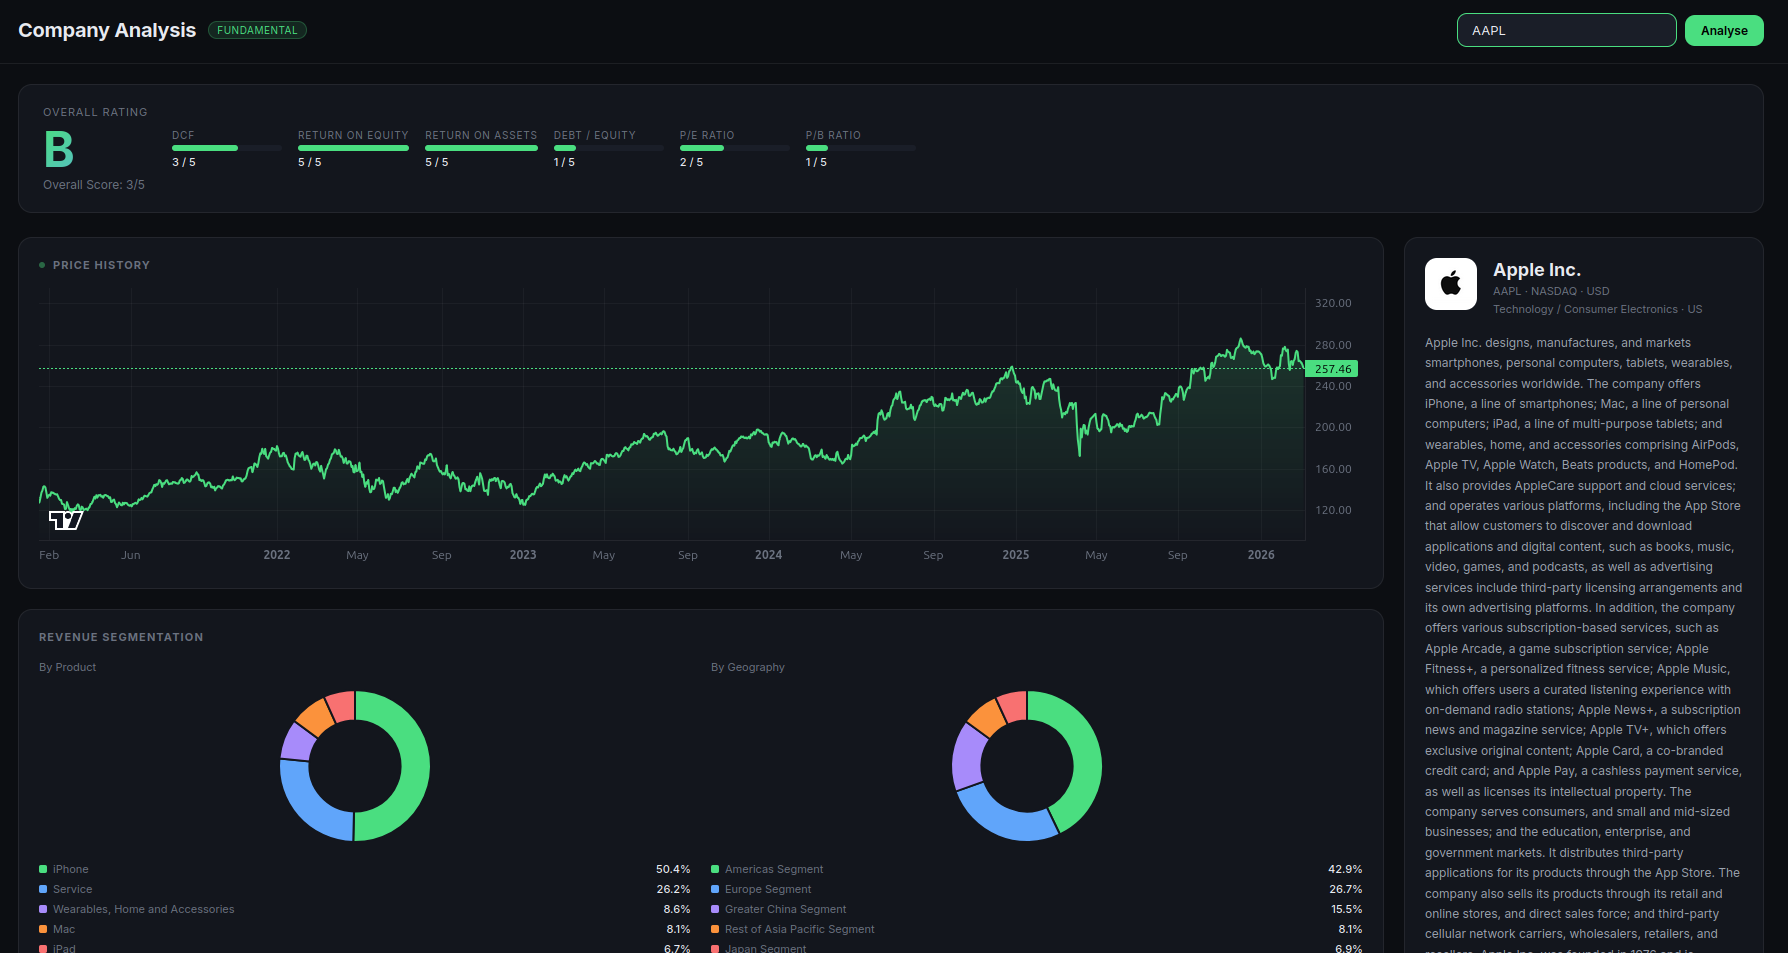
Deep dive into individual companies with fundamental analysis, DCF valuation, revenue segmentation, and historical price data.
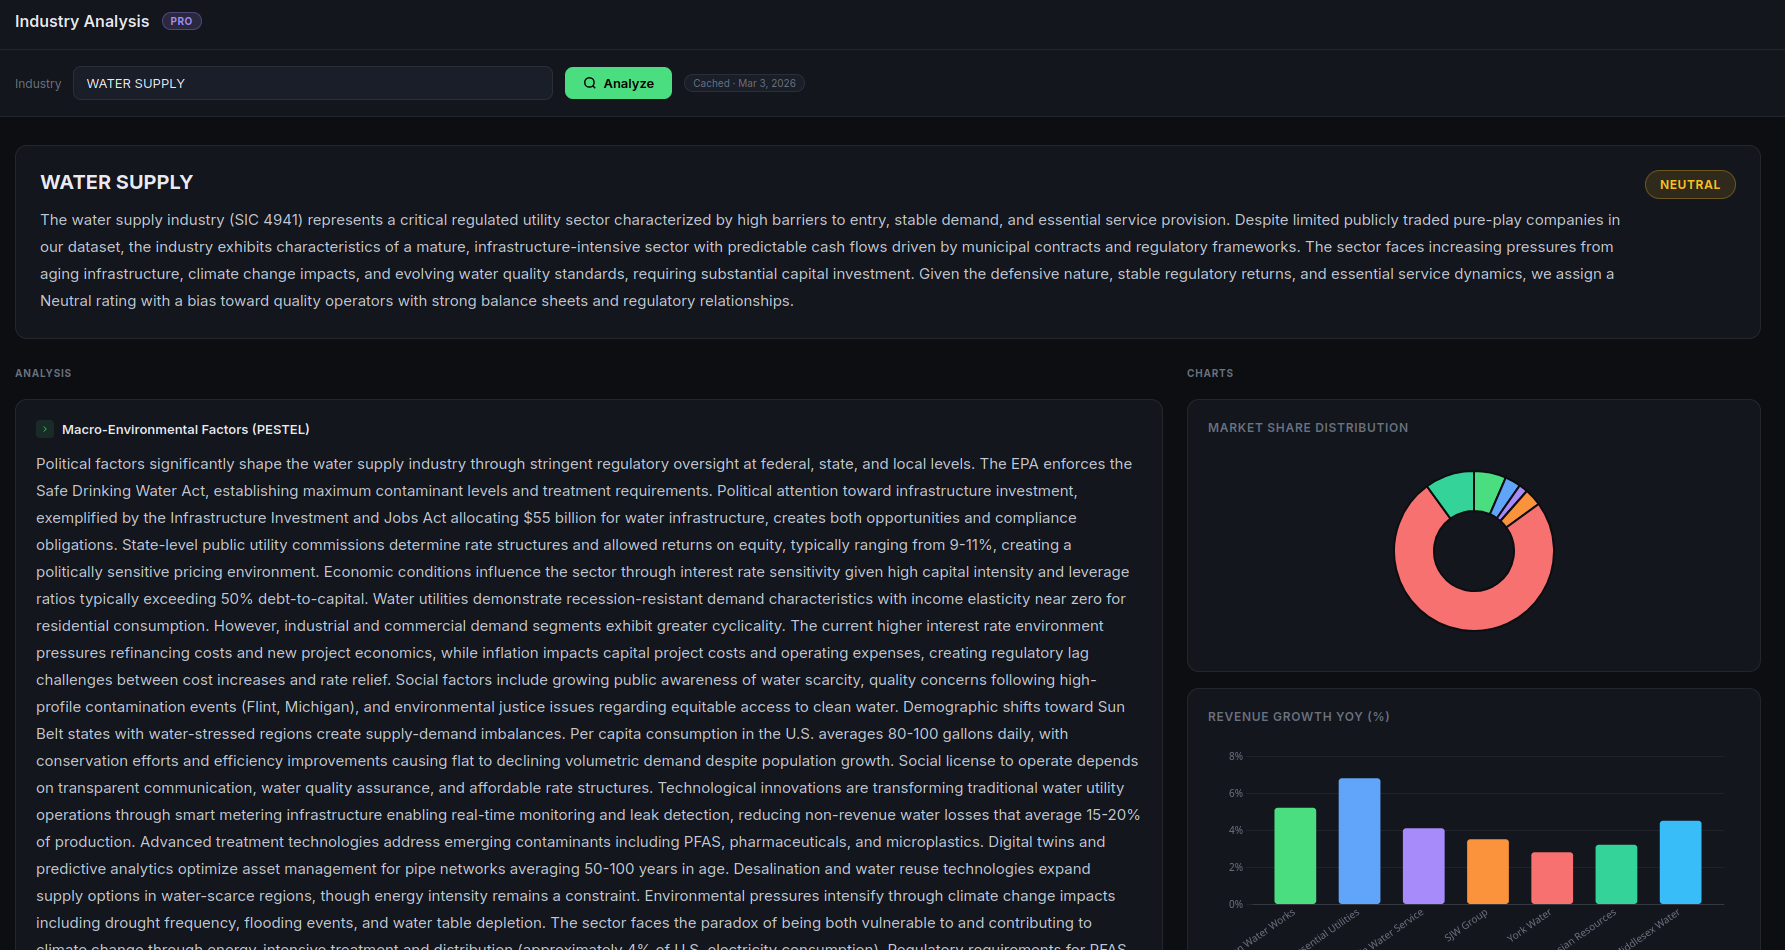
Explore sector trends, compare industry peers, and identify opportunities with comprehensive market segment breakdowns powered by Claude
Choose the plan that's right for you